
As we head into 2023, the San Diego real estate market is already looking much different than it did this past year.
Mortgage interest rates have dipped, creating a surge in buyers who are ready to make their move—but how can you use this opportunity for success?
In our latest Real Estate Market Report, we’ll look back at what happened over the course of 2022 and also reveal some strategies that could give you an edge when planning ahead! So while 2022 may be your guidepost now – keep an eye out on late Q1 this year; something tells us there might just be a few surprises coming down the road…

2023 San Diego Housing Market Predictions | LuxeAlly Real Estate
Is 2022 is the best guide to the 2023 housing market?
What happened yesterday has more bearing on today than what happened five years ago, so we’re shortening our lookback window to get a better understanding of what’s to come.
This isn’t to say we can’t use history or that it should be dismissed entirely; rather, the pandemic set in motion a series of events that led to a different housing market, a different overall economy, and a different world when compared to pre-pandemic times.
Major U.S. Housing Events 2020 – 2022
Mid-March 2020 – May 2020: Concern over COVID-19 skyrocketed, leading to shelter-in-place orders across the United States and around the world. Seemingly everything shut down — including the real estate market because it’s very hard to buy or sell a home when you aren’t supposed to gather.
By about the end of May 2020, it became clear that the virus wasn’t going away quickly, triggering the housing boom and the start of ultra-low mortgage rates.
June 2020 – December 2020: Asset prices, from housing to stocks to crypto to art, exploded due to a combination of easy money and a change in consumer behavior.
The Federal Reserve lowered interest rates and poured money into the market, increasing the amount of money in circulation by 17% from February 2020 to May 2020.
By the end of 2020, the money supply increased 24%, and by the end of 2021, it had risen 40%. Buyers were priced into the market as mortgage rates declined under 3% for the first time ever.
Without a clear end to the pandemic in sight, buyers were incentivized to find a home they wanted to spend a lot of time in not only for rest, but also to work.
With the increase in buyers, demand outstripped supply like we’ve never seen before. The number of homes for sale in the United States declined 34% in six months, while overall home prices increased 9%, according to the S&P/Case-Shiller 20-City Composite Home Price Index.
January 2021 – December 2021: The year opened with the lowest 30-year average fixed mortgage rate on record: 2.65%. Mortgage rates hovered around 3% the entire year, with an average mortgage rate of 2.96% in 2021.
The increase in buyers in the second half of 2020 was only a preview for 2021 sales, which were the highest since 2006. By the end of the year, home prices increased another 17% (29% in total since May 2020), and the number of homes for sale fell 52% since May 2020. Additionally, inflation rose quickly, and we closed the year with inflation at 7.09%, a level not seen since 1982.
The Fed had one main tool to combat inflation: raising interest rates. Because the Fed said in December that it would begin raising rates in March 2022, it created the final buying boom as buyers and sellers rushed to the market to lock in low rates.
January 2022 – June 2022: The last true sales spike occurred during the first quarter of 2022, which drove home prices up 5%. Sales began to slow, as did price growth.
Home prices reached an all-time high in June 2022, increasing 42% since June 2020, which was the sharpest and quickest rise in home prices ever recorded. By the end of June, mortgage rates had risen 2.6% in 2022, which drastically decreased affordability.
July 2022 – December 2022: During the second half of 2022, the housing market cooled significantly.
Demand softened for several key reasons: higher interest rates, a return to seasonal market trends where prices increase in the first half of the year and decrease slightly in the second, and mean-reversion (about a million homes were sold above the average in 2021, and about a million fewer than the average were sold in 2022).
We closed the year with high and volatile mortgage rates, hitting 20-year highs in October and November. The fourth quarter gives us a decent picture of what’s ahead.
The Local Lowdown
San Diego County’s housing market is entering 2023 relatively balanced between buyers and sellers.
Home prices are showing signs of stabilizing, a likely sign that prices will start appreciating by the spring, as more inventory comes to market.
The housing market from 2020 to 2022
The housing market from 2020 to 2022 was an outlier, so it is adjusting back to more typical seasonal trends in 2023.

San Diego County’s housing market is entering 2023 relatively balanced between buyers and sellers.
New year, old normal
Demand in San Diego is evergreen, so we aren’t worried about matching buyers and sellers. That said, sellers likely won’t be getting 12+ offers the second the home hits the market again anytime soon.
To make a long story short, there is definitely less stress on the buying side of the market. Prices will most likely increase in 2023, but at a more modest rate of around 5-6%, which makes for a much healthier market than what occurred over the past three years.
Single-family home prices increased 18% over the past two years, even with the 12% decline from the April peak to December 2022, and condo prices were up 27% despite a 13% decline from the May peak. When we look back further to Q4 2019, single-family home and condo prices have increased by 42% and 47%, respectively.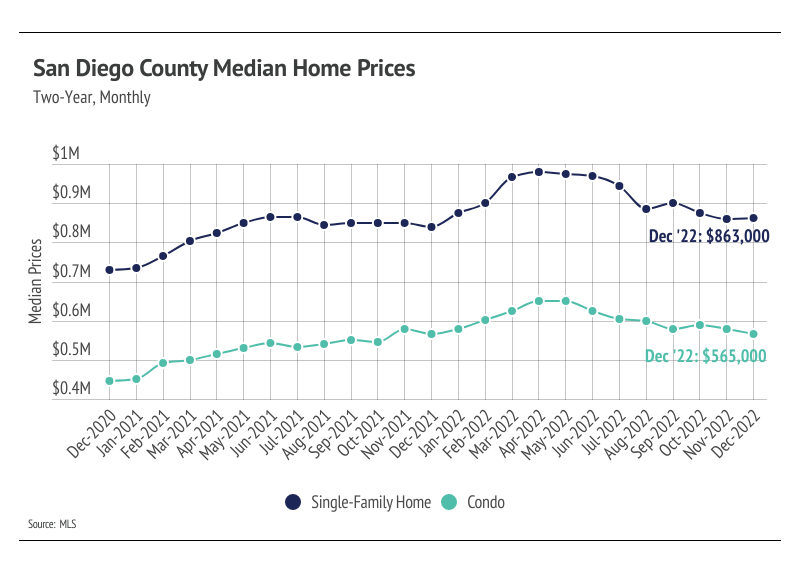
More new listings should come to the market in the first quarter
When we look at single-family home inventory levels for 2021 and 2022 side by side, it’s immediately apparent that inventory levels in any given month were incredibly similar, but the markets were remarkably different.
The 2021 market was defined by the high number of new listings, which helped drive higher sales. New listings and sales rose and fell in tandem. In 2022, however, far fewer listings came to market, but new listings still rose from January through June, while sales began to decline after the first quarter. Fewer homes and the rising rate environment dropped demand, allowing inventory to grow at a similar rate as the year before.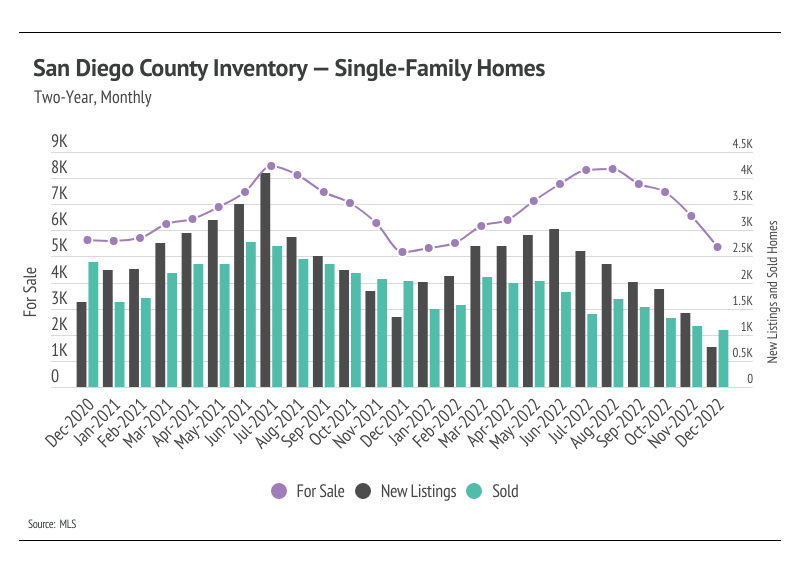
The condo market had a simpler story in that there were far fewer new listings without a proportional decline in sales, so inventory remained low. This year, we expect the housing market to look a lot more like 2022 than 2021.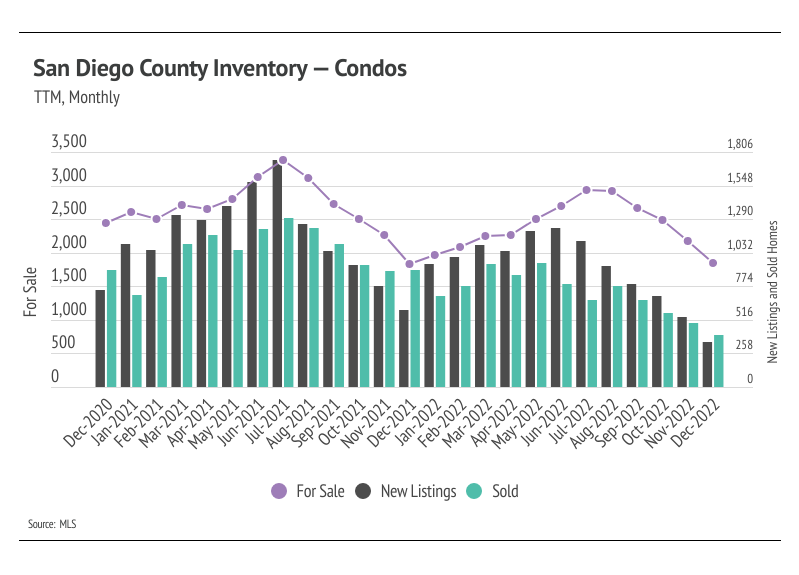
Months of Supply Inventory implies a balanced market
Months of Supply Inventory (MSI) quantifies the supply/demand relationship by measuring how many months it would take for all current homes listed on the market to sell at the current rate of sales.
The long-term average MSI is around three months in California, which indicates a balanced market. An MSI lower than three indicates that there are more buyers than sellers on the market (meaning it’s a sellers’ market), while a higher MSI indicates there are more sellers than buyers (meaning it’s a buyers’ market). MSI has trended higher, from a sellers’ market toward balance, since late spring 2022.
If you value this report and want others to understand what’s happening in San Diego’s housing market, please share it by clicking the icons below!
Buying or selling a home in San Diego? Please contact us today so we can begin working towards achieving your ideal real estate goals! 858.630.8997